
With the information developed in Chapters 1 and 2, your next step is to utilize three time-tested tools to assess the efficiency of your existing layout and test proposed improvements.
See Chapter 2 here.
Document the plant’s flow intensity
The From-To Chart summarizes the sequence and intensity of material and component movements required to manufacture the representative product mix. Its objective is to highlight the pairs of Process Elements with the heaviest flows.
To populate the chart the component volumes that move from Element to Element must be estimated. Using the Process Sequence Charts developed in Chapter 1 you can extrapolate the component sequences for each product and quantify the flows by multiplying the quantity per period of each product by the individual component requirements.
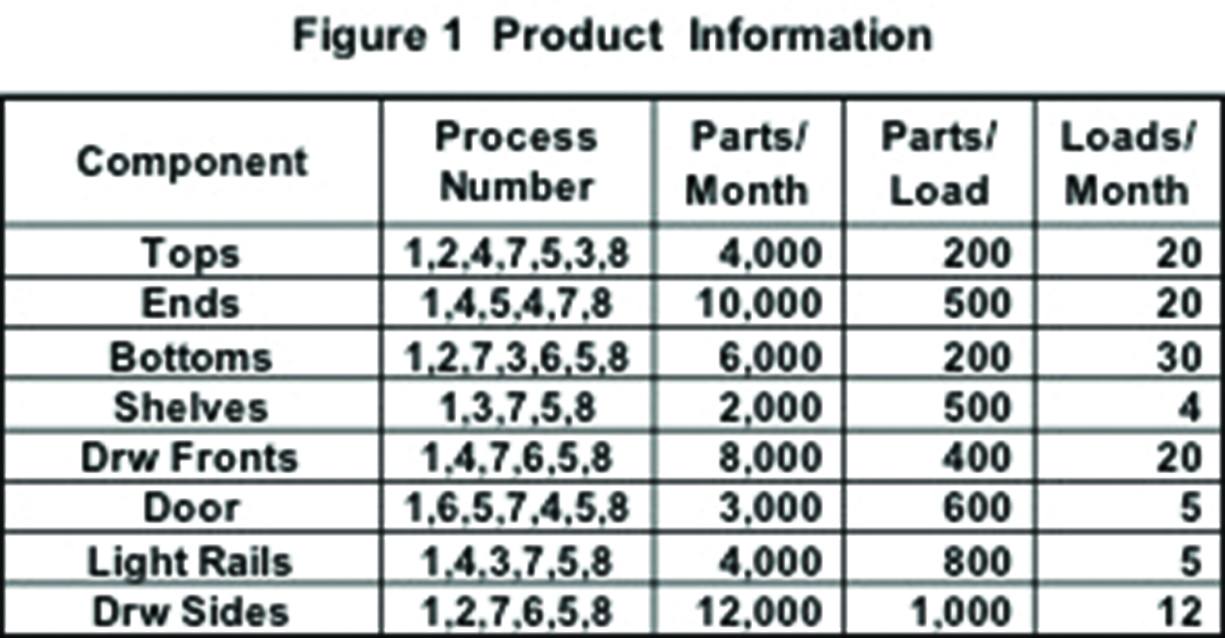
Figure 1
Next you must convert each component’s volume into the number of cart or pallet loads that must be moved through the plant during the period. Figure 1 shows a simple table that estimates the number of loads for each process sequence. For purposes of this illustration the Elements in each process sequence are referred to by numbers rather than names such as Panel Mill, Finishing, etc. Figure 1 tells you that 4,000 Tops per month requires 20 loads each consisting of 200 individual tops. Those 20 loads will move from Process Element 1 to Process Element 2 then to Process Element 4 and so on until the Tops are completed at Process Element 8.
To construct the From-To Chart shown in Figure 2:
- Create a matrix for each product listing the name of the plant’s Elements in identical order across the top of the columns and down the rows on the left hand side of the matrix. Note that if the lists follow the general flow in your plant, entries below the diagonal line show any backtracking required by your existing layout

Figure 2
- Note the number of loads in the cell for each pair of Elements in a component’s sequence and total the loads once all components for a product are entered. For example the cell for movements from Element 4 to 5 consists of 20 loads of Tops plus 5 loads of Doors for a total of 25 loads.
- Complete a From-To Chart for each family of products in your representative mix. Don’t forget to map the movement of waste, rework, empty carts, and supplies.
- Sum the row and column sub-totals to the lower right hand cell. If those results are equal, your Chart is accurate.
Estimate handling cost
To achieve the optimal arrangement of a plant’s Elements, you must consider the cost of handling. Using the distance between Elements as a proxy for handling cost, the Travel Chart computes the total distance that loads of materials and components must move. To populate this tool:
- Measure the distance between each pair of Elements using your CAD layout and record the findings on a clean From-To matrix.
- Multiply the number of loads moved between each pair of Elements on the product’s From-To Chart by its relevant distance, enter the results on the new matrix, total all rows and columns to the lower right-hand cell, and check for accuracy.
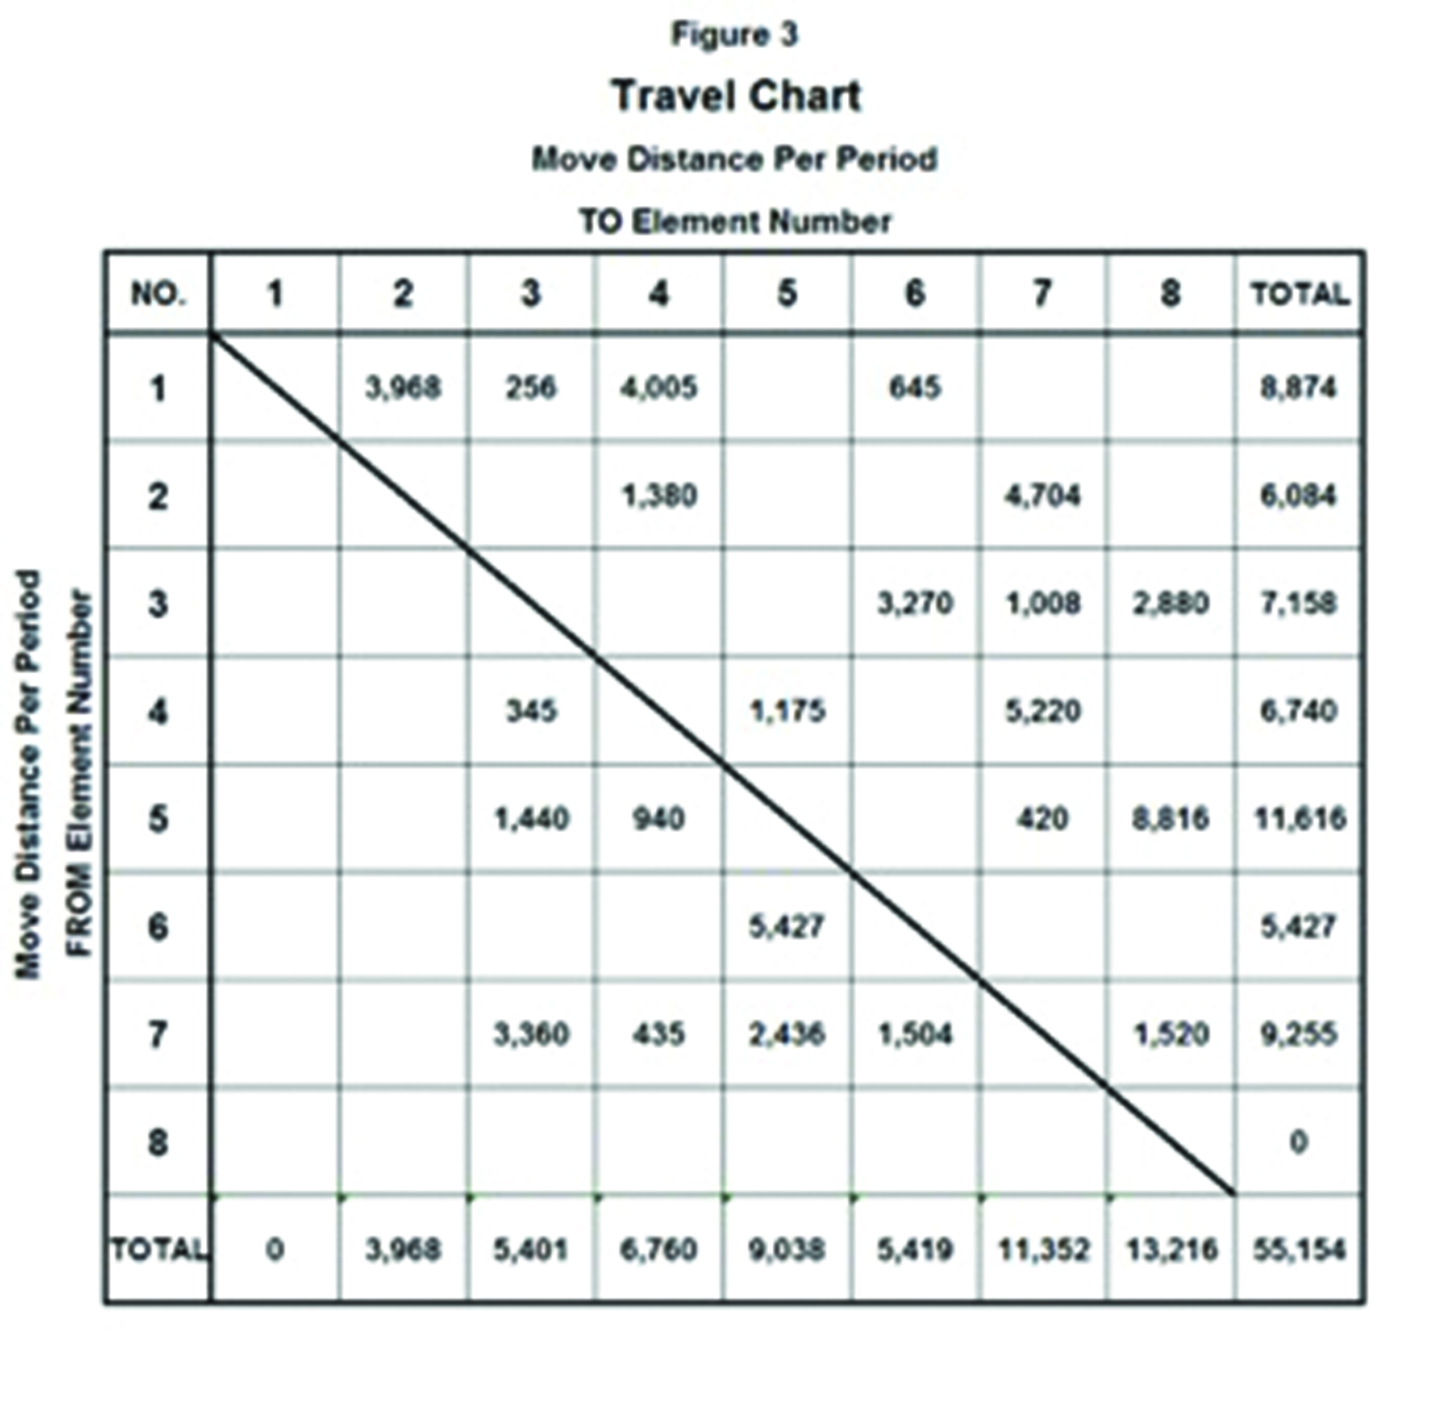
Figure 3
By using total handling distance to score a layout’s efficiency, the Travel Chart provides a simple yet powerful method for ranking alternative layout designs against an existing plant arrangement. In addition it is useful for evaluating the efficiency of complex individual Elements consisting of a large number of machines or work centers. In either case your objective is to minimize the number in the lower right-hand cell.
Considering Non-Flow Layout Factors
The arrangement of Elements into an effective overall facility cannot wholly be determined by the physical flow of materials and components. When arranging Process Elements you must also allow for Support Elements, operational issues, and infrastructure such as:
- Support Elements – rest and lunch rooms, tool rooms, maintenance shops
- People Sharing – supervision, communications
- Equipment Sharing – utilities, other infrastructure, expensive machinery
- Environmental – safety, security, noise, building requirements
To take into account these non-flow concerns layout planners use a tool called the Activity Relationship Chart (see Figure 4).
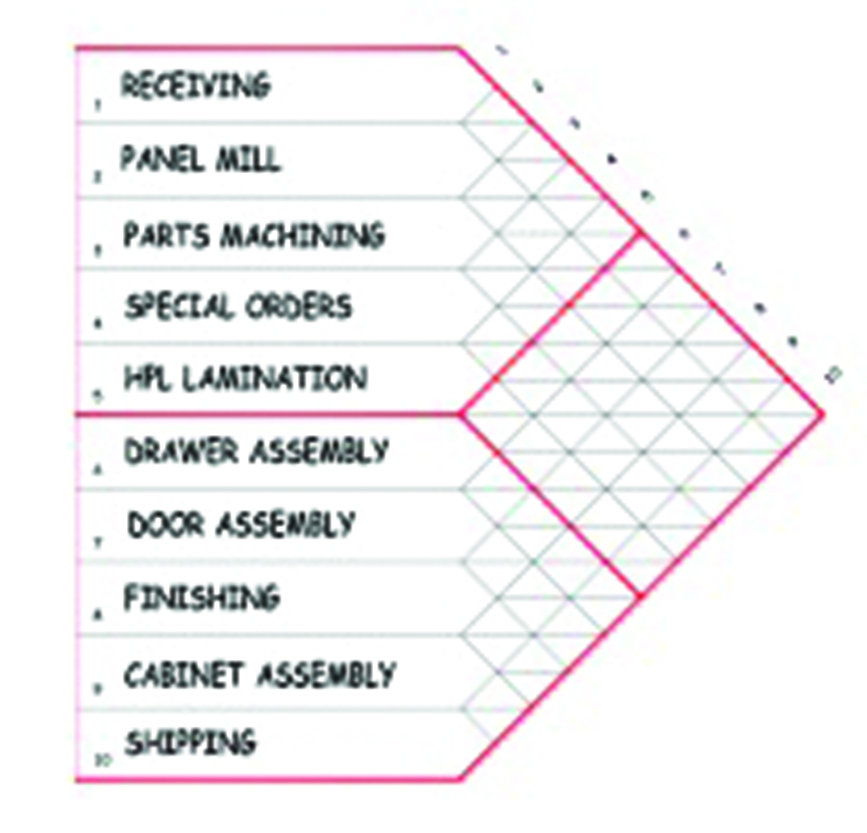
Figure 4
Similar in form to the cross-sectional mileage table shown on many maps, the two halves of the diamond-shaped boxes enable the planner to describe the importance of the relationship of every pair of Elements and the reason for the proximity.* Figure 5 illustrates how that information is recorded in the intersecting boxes for every pair of Elements.
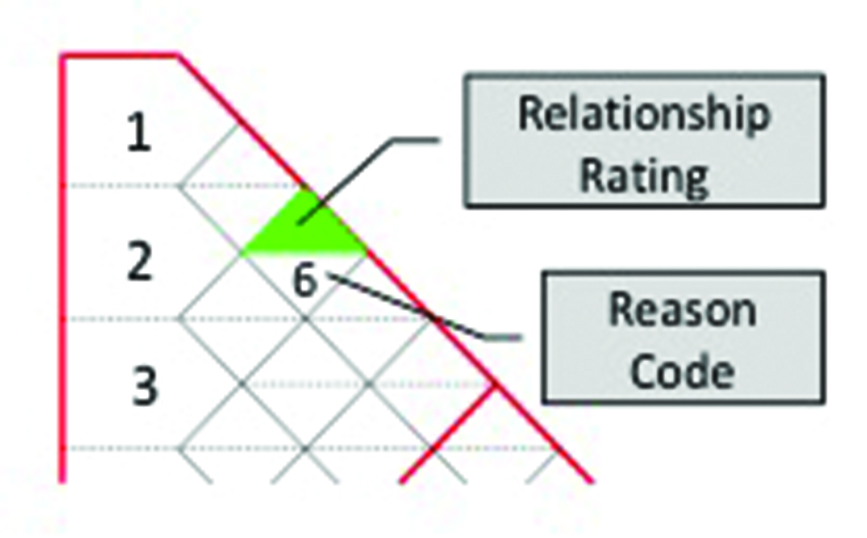
Figure 5
Figure 5
Close-Up of Relationship Chart
Between Element 1 & 3
The color in the upper half of the square indicates the importance rating of the relationship:
- Red Absolutely necessary
- Green Especially important
- Blue Important
- Yellow Ordinary
- Uncolored Unimportant
- Orange Not desirable
The number in the lower half indicates the reason for the closeness rating:
1 = materials flow
2 = communications
3 = equipment sharing
4 = personnel sharing
5 = supervision
6 = utilities sharing
7 = safety
*Templates of the Activity Relationship Chart in AutoCad can be downloaded at -----.
To evaluate your existing layout, develop a Relationship Chart that illustrates the ideal arrangement of Process and Support Elements. Then review each box to identify those pairs that demand attention in your layout planning. You should involve all knowledgeable and affected personnel in the assignment of the reason and rating codes.
Milestone
You now have the key information necessary to rationalize your layout: the product and quantity to be made and the process requirements for its manufacture. By carefully analyzing that information you have detected the opportunities for improvement.
Your next step is to develop alternative block layouts that map out the estimated sizes, configurations and proposed locations of the necessary Process and Support Elements. This effort often requires a balancing act between the space required and the space available for the various Elements. More on that task in the next Raymond’s View.
Credit: Every student, teacher, and engineer who has read the late Richard Muther’s Systematic Layout Planning will recognize his fingerprints on this series.


Have something to say? Share your thoughts with us in the comments below.