
Consumers continue to embrace the “phygital” — and retailers are responding. 2023 saw several virtual stores adding a physical presence, and physical stores enhancing their online presence. The 16th Annual Global Shopper Study by Zebra Technologies saw 71% of shoppers of all ages combining in-store and online, 17% in-store only and 12% online only. In addition, 82% said physically seeing, touching or trying products was important to the shopping experience, and of those shopping online, 75% noted a preference for purchasing from retailers that also had a physical presence.
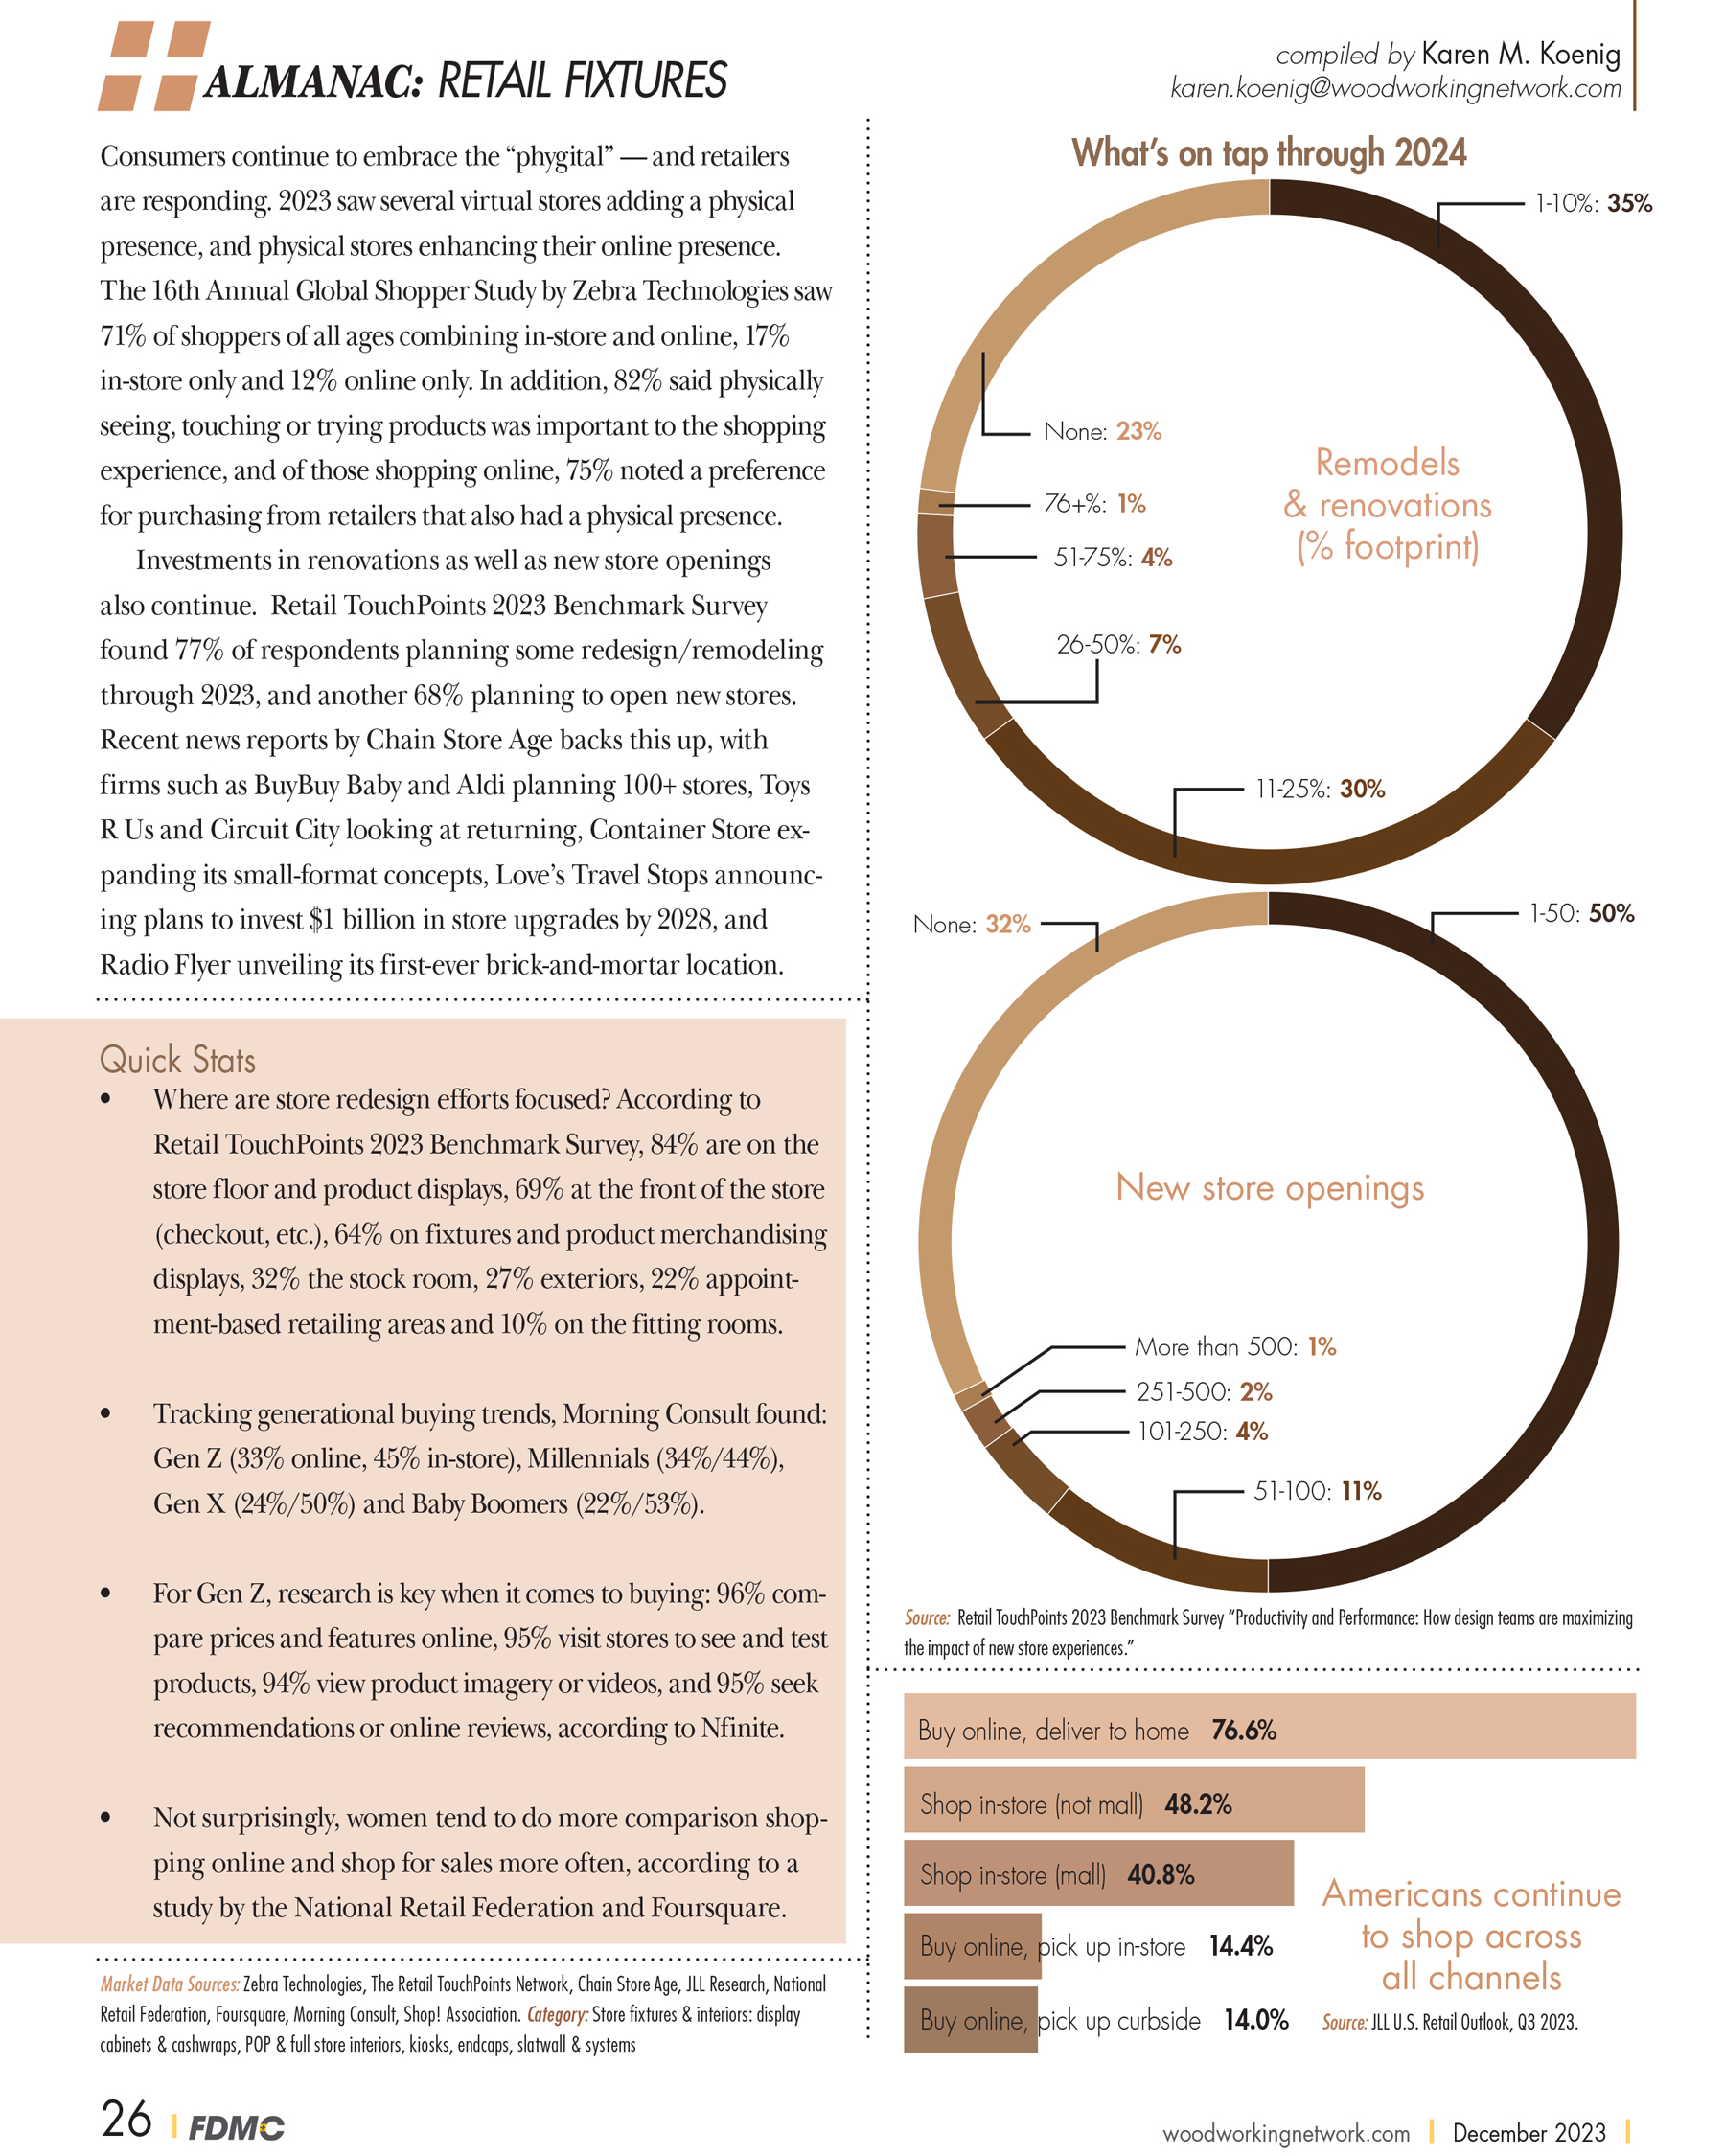
Investments in renovations as well as new store openings also continue. Retail TouchPoints 2023 Benchmark Survey found 77% of respondents planning some redesign/remodeling through 2023, and another 68% planning to open new stores. Recent news reports by Chain Store Age backs this up, with firms such as BuyBuy Baby and Aldi planning 100+ stores, Toys R Us and Circuit City looking at returning, Container Store expanding its small-format concepts, Love’s Travel Stops announcing plans to invest $1 billion in store upgrades by 2028, and Radio Flyer unveiling its first-ever brick-and-mortar location.
Click on the infographic to enlarge. Find more market data in the December 2023 FDMC Wood Industry Almanac.
Quick Stats (Includes items not shown in print.)
Where are store redesign efforts focused? According to Retail TouchPoints 2023 Benchmark Survey, 84% are on the store floor and product displays, 69% at the front of the store (checkout, etc.), 64% on fixtures and product merchandising displays, 32% the stock room, 27% exteriors, 22% appointment-based retailing areas and 10% on the fitting rooms.
Tracking generational buying trends, Morning Consult found: Gen Z (33% online, 45% in-store), Millennials (34%/44%), Gen X (24%/50%) and Baby Boomers (22%/53%).
For Gen Z, research is key when it comes to buying: 96% compare prices and features online, 95% visit stores to see and test products, 94% view product imagery or videos, and 95% seek recommendations or online reviews, according to Nfinite.
Not surprisingly, women tend to do more comparison shopping online and shop for sales more often, according to a study by the National Retail Federation and Foursquare.
While consumers may browse online, for most major purchases they prefer buying in-store. TraQline (Home Improvement Research Institute) found 51% of U.S. and 53% of Canadian consumers purchased their windows and doors in-store, vs. 14% and 11% respectively online. When it comes to flooring, 81% of U.S. and 82% of Canadian consumers purchased in-store vs. 9% online for both groups. Furniture purchases were about 50-50.
Market Data Sources: Zebra Technologies, The Retail TouchPoints Network, Chain Store Age, JLL Research, National Retail Federation, Foursquare, Morning Consult, Nfinite, Shop! Association, TraQline. Category: Store fixtures & interiors: display cabinets & cashwraps, POP & full store interiors, kiosks, endcaps, slatwall & systems.
More data on North American woodworking and the specific wood product market segments can be found in the December 2023 FDMC Wood Industry Almanac. Also, find market data year-round at WoodworkingNetwork.com/news/almanac-market-data.


Have something to say? Share your thoughts with us in the comments below.